Displaying Charts in Lists
Description
Add a chart to your List layout using the List Chart field.
Discussion
You can create Lists which display charts in each List row. The available chart types are: line, bar, gauge and pie. The data in the chart comes from the data in the List row.
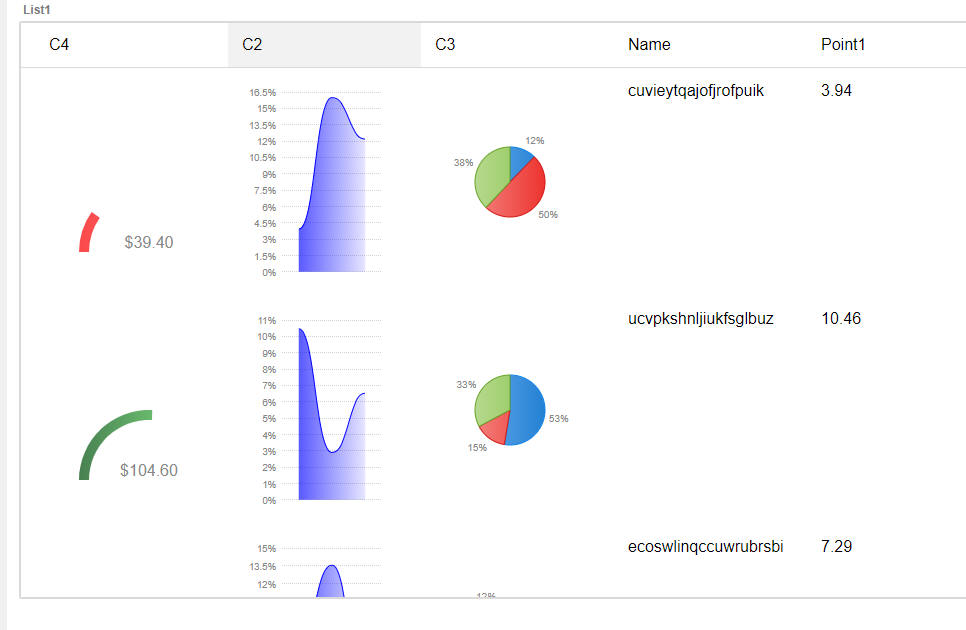
In the image below, each row is displaying a Gauge, Line, and Pie chart. Notice that in the first List row, the gauge is red because the value is below a threshold value and in the second row it is green because the value is above the threshold value.
To add a chart to a List definition, go the Fields tab in the List builder and then click the Add Item button.
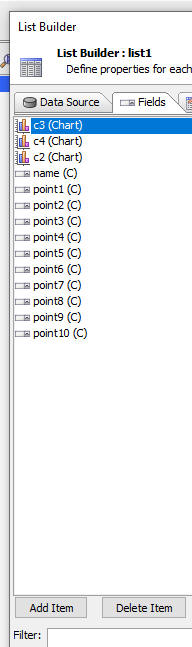
From the list of available item types, select Chart.
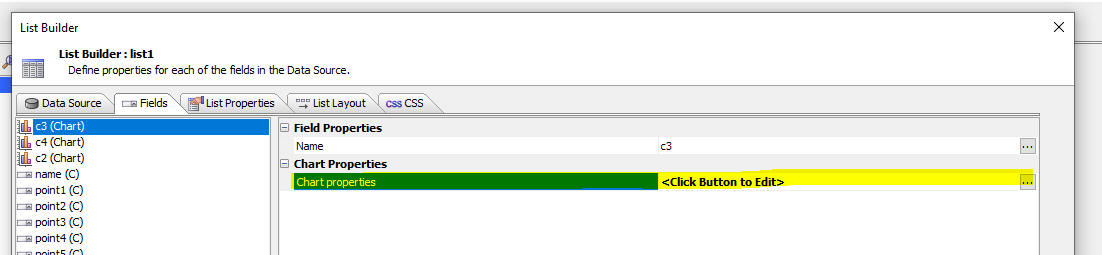
Then click the smart field for the Chart properties to configure the chart.
The properties shown in the builder vary based on the type of chart you select. For example, in the image below, the builder for the Gauge chart is shown:
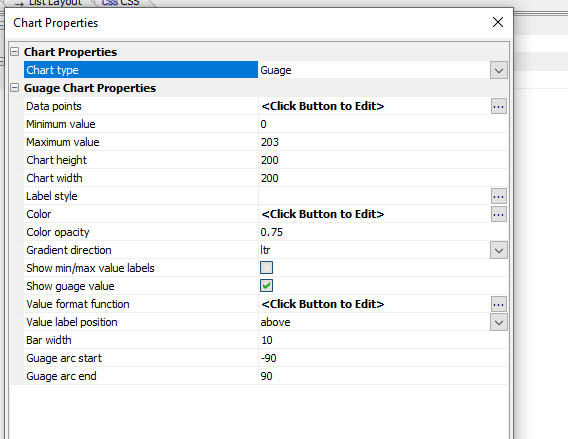
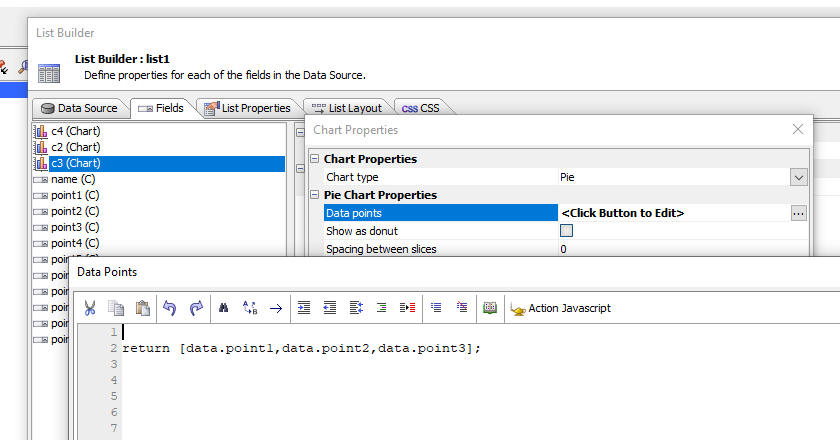
Regardless of the chart type you select, the builder will have a property called Data points where you define the Javascript that returns the data to display in the chart. Typically you will return data from the current List row.
For example, in the image below the Javascript for the Data points property is shown for the Pie chart.
The pie has three slices and so the Javascript returns an array of 3 data points. In this case the data points are the point1, point2 and point3 fields in the current List row.
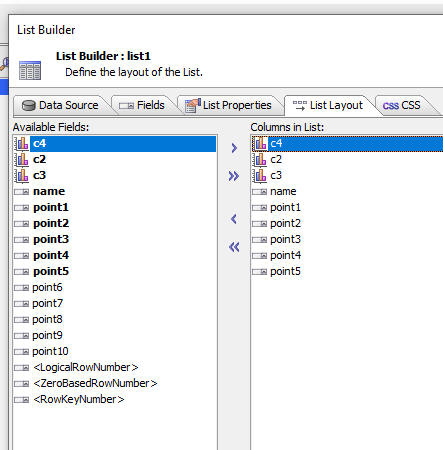
Once you have configured the chart you can add the chart to the Layout just like you add any other control to a List Layout. For example, in the image below, the first three columns in the List layout display different charts.
Videos
In-row Charts
In this video we show how you can display charts in a List. Each row in the List can have a line, bar, pie or gauge chart and the data shown in the chart can come from other data in the List row.